About the Kinase Atlas
Kinases are major drug targets in the pharmaceutical industry, as they are responsible for regulating the activity of other proteins, and their dysfunction has been linked to many diseases, such as cancer, diabetes, inflammation, and neurodegeneration. Kinase inhibitors are classified by where on the kinase they bind; most existing FDA-approved inhibitors are “type I”, meaning they bind in the active site, which is located between the conserved N- and C-terminal domains of the kinase catalytic domain and which normally binds ATP. Several types of kinase inhibitors are described in the table below:
| Binds in the active site | ||
| Binds in part of the active site as well as the adjacent “DFG-out” pocket, which is present in the inactive form of many kinases | ||
| Binds in a pocket near the ATP and DFG-out pockets that is present in the active form of some kinases | ||
| Binds away from the active site entirely |
The Kinase Atlas is intended to provide information on whether a kinase could potentially be targeted by a type II, III, or IV inhibitor, since the development of non-type I inhibitors has been pursued far less than that of type I despite two potential advantages: (1) the active site is highly conserved between kinases, and thus to design an inhibitor that binds only to a particular kinase can be challenging if the active site is the only region being targeted, and (2) type III/IV inhibitors do not need to compete with ATP, which is present in high concentrations within the cell, as they bind in allosteric pockets rather than occupying the active site.
In order to determine potential regions for non-type I inhibitors to bind, we have identified a total of twelve sites on the kinase catalytic domain that have been described in the literature as allosteric; these sites are described in the following table:
| Hydrophobic pocket that opens up when DFG motif switches to inactive "DFG-out" conformation; binding here may stabilize inactive kinase conformation | |||||
| Adjacent to ATP and DFG-out pockets; binding disrupts salt bridge required for kinase activity | |||||
| PDK1 regulates other AGC kinases by recruiting them through this site | |||||
| p38a peptide binding inhibits MKK4 by inducing conformational changes that lead to auto-inhibition | |||||
| Binding here leads to active or inactive state in c-Abl (depending on ligand size) by affecting SH domain binding | |||||
| Myristoyl binding here activates membrane binding in PKA | |||||
| Substrate docking site present in all MAP kinases | |||||
| Substrate docking site present in some MAP kinases; located near MAPK insert | |||||
| Binding of different lipids here affects p38a MAPK's preference and activity for different substrates | |||||
| Substrate recognition site located near PDIG motif in Chk1 | |||||
| An Aurora A monomer activates another through binding of its activation segment to this site | |||||
| An EGFR monomer activates another by binding at this interface on the C-terminal domain |
The location of each site is also visualized below, where the N-terminal domain is shown in green, the C-terminal domain is shown in gray, and ATP is shown in yellow.

To determine whether each kinase is druggable at each potential allosteric site, we have used FTMap, our computational solvent mapping algorithm, to identify the most favorable regions for binding on all kinase structures available in the PDB. FTMap detects binding hot spots, which are regions within a binding site that contribute disproportionately to the binding free energy, by docking a variety of small “probe” molecules to the surface of the protein and identifying locations that bind both a large number and variety of probes. These clusters of probe molecules, which we call “consensus sites”, represent both the location and “druggable” potential of the binding hot spots, as the size of a consensus site corresponds to the potential affinity for ligands to bind there--that is, a larger number of probe clusters indicates a greater potential binding affinity.
FTMap results for each kinase structure were then compared to the locations of the potential allosteric sites; if a strong binding hot spot (that is, a consensus site with 16 or more probe clusters) was present in one of the potential allosteric sites, then that kinase was considered to be “druggable” at that site. The mapping results for each individual kinase structure are available here at the Kinase Atlas, and summarized results for kinases with multiple structures are also provided.
Example
To look at results for a particular kinase, click on its name in the phylogenetic tree on the main page, or on “Browse Kinases” in the header, which lists kinases by UniProt accession. The summarized results page for each kinase contains a table listing which allosteric sites are present in the kinase, as well as their potential strength for binding ligands, which is based on the populations of their associated consensus sites.

Results for each structure of the kinase are also included, with sites that are “druggable” in each structure (consensus site population greater than or equal to 16) highlighted in green, and the total number of druggable structures for each potential allosteric site is listed in the final row.

Mapping results for individual kinase structures can be accessed through these summarized results pages, or through “Browse Structures” in the header, which lists kinase structures by PDB ID.
The table lists consensus sites for the mapped structure that correspond to one of the potential allosteric sites. Consensus sites that do not correspond to any allosteric sites are not listed.

The mapped structure can be visualized below by selecting a chain to be viewed from this menu (highlighted in red). The N-terminal domain is shown in green, and the C-terminal domain is shown in gray, and the consensus sites are visualized as sticks of varying colors.
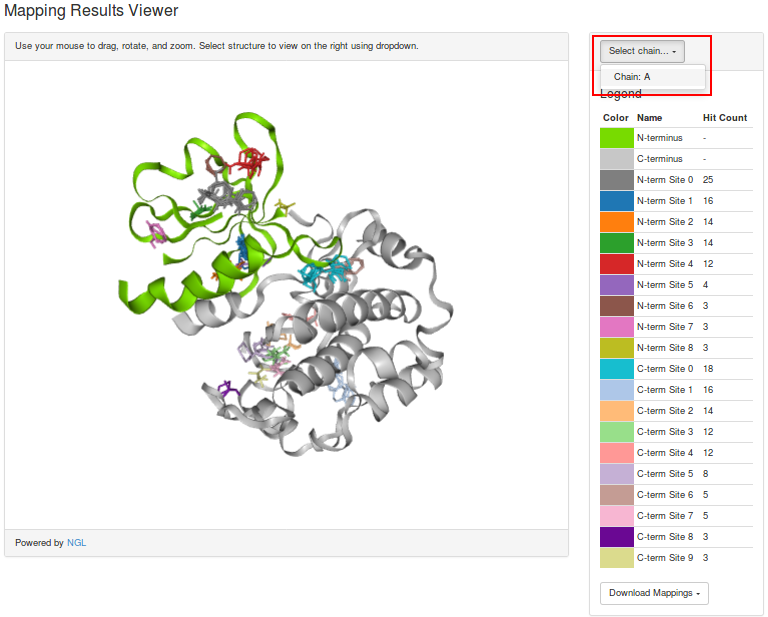
Alternatively, mapping results can be downloaded by selecting a chain from this menu (highlighted in red).
